The Visual Debugger
Have you ever wanted to look over the shoulder of Python as it was running your code? It’s a useful ability because you get to compare how you think your code is run with how Python actually runs it. This is extraordinarily helpful if you’re trying to find bugs.
This is what Mu’s simple visual debugger allows you to do with Python 3 code.
The functionality provided by the debugger happens in three places.
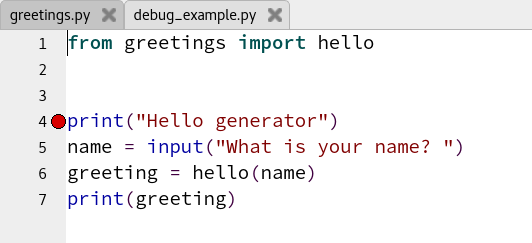
First of all, while in Python 3 mode or when the debugger is running, it’s possible to indicate where Python should pause execution of your script (giving you an opportunity to look around at that point). This is done with a breakpoint, indicated by a circle in the margin next to the line-numbers and toggled on and off by clicking the line number of the desired line. In the picture below, there’s a breakpoint set on line 4, and the debugger will run your code up until this line, at which point, it will pause:
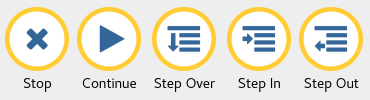
Secondly, when you click the “Debug” button, two things will happen: your code will be run under the control of the debugger (as a result, it takes a little longer than normal for your code to start running), and the buttons associated with the Python 3 mode will be replaced with the following new buttons that allow you to navigate your code:
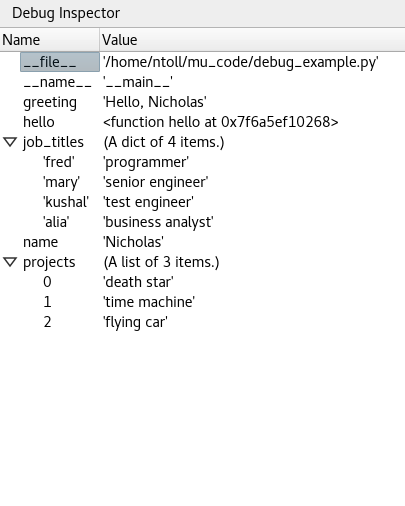
Finally, while the debugger is running the inspector pane will appear on the right hand side and list all the objects Python knows about at that moment in the execution of your script, along with their associated value. This allows you to see into the current state of your program and check things are as you expect them to be.
Just like when you “Run” a program, a new pane will appear below the code area and above the footer. This will contain any textual input and output for your program.
To avoid the potential for confusion, when the debugger is running, you won't be able to change your code. This is because Python's debugger runs your program as it existed when you clicked the "Debug" button. If you were able to change it after this point, there is a possibility that the code the debugger highlights in your code area doesn't actually exist in the running program.
If you click the “Debug” button without having first set some breakpoints then the debugger will pause on the first available line.
In any case, once the debugger has control of your program, it will highlight the line in your code that Python is about to execute, update the inspector with the names and values of all the things it curretly knows about and wait for you to do something. At this point you can use the buttons to navigate your code.
The “Stop” button does what you expect: the debugger stops and you’re returned to Python 3 mode.
The “Continue” button will run your code until either the next breakpoint is reached (at which point, the debugger will pause again) or your program finishes.
The “Step Over” button moves forward through your code one line at a time, no matter if there is or isn’t a breakpoint on the next line. It means you can watch as each individual line of code effects the state of your program.
Sometimes the debugger will highlight a line that calls a function. If you were to “Step Over” this line then you’ll move onto the next line without seeing what the function was doing. But what if you wanted to step into the function that was called, to see what that block of code did? Well, that’s the purpose of the “Step In” button. Instead of moving onto the next line in the current block of code, it’ll skip into the function and highlight the first block of code in the function.
Of course, you may find yourself in a function which isn’t very interesting and you just want to move back to the line of code that called it (rather than having to keep pressing “Step Over” until you got to the end of the function). Happily, this is exactly what the “Step Out” button does: if you’re in a function, it’ll move to the line of code immediately after the line that called the current function.
All these sorts of interactions are illustrated below.